Two weeks ago I spent a weekend down in London at an event called Digital Sizzle 6. The idea was simple: take 50 technically minded people and 50 artistically minded people, bring them together to collaborate for 48 hours and see what comes out of it. The result was a lot of fun, not much sleep, and some fascinating projects.
Our brief was to create art out of data, a simply stated goal which gave rise to a lot of creativity. By the end of the weekend we had a dress made of Instagram photos, a machine to recreate the weather of faraway cities, a website that made “music” from the movement of fish and lots more.
Our project - Gaia
I went down on the Friday night without any real ideas of what to do, expecting to find somebody there to work with. This was a deliberate move to force me out of my comfort zone and get me collaborating. At the previous two hackathons I’ve been to I ended up working mostly on my own and I wanted to avoid that this time.
In the end I joined up with a team of people who wanted to make something out of London transport data. There were eight of us with a lot of different ideas floating around and we came up with two related pieces.
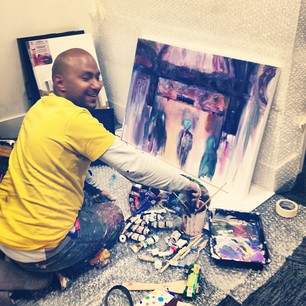
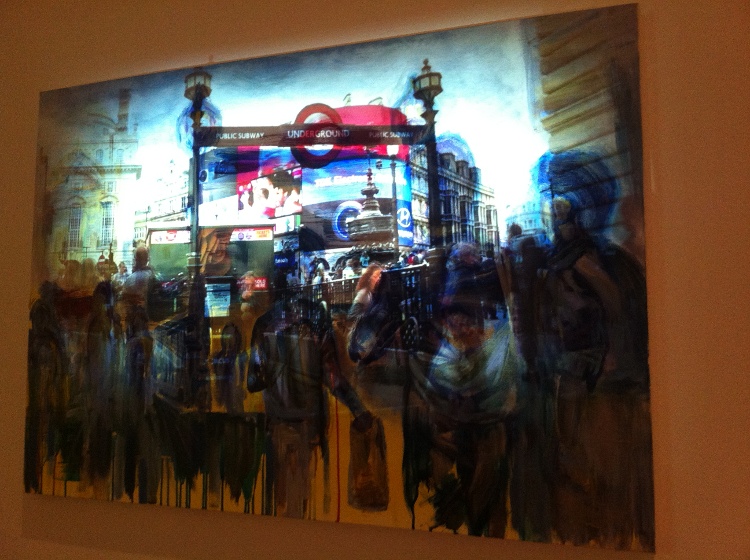
The first piece was a merging of painting and digital video. Mo worked through the night on Saturday to paint pictures of two tube stations. The mood of the paintings was inspired by sentiment analysis of tweets mentioning those particular tube stations and lines (as you’d expect, the sentiment was mostly negative).
Over the top of these we projected video footage that had been taken from the same viewpoint as the paintings. The effect was pretty awesome, but you really have to see it moving to appreciate it properly.
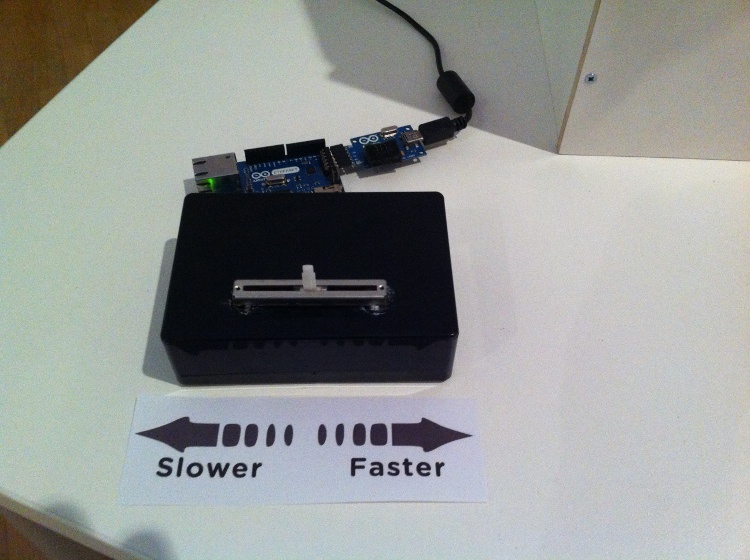
To add a touch of physical engagement Sam hooked up a couple of sliders so that people viewing the videos could slow down or speed up the videos.
Our second piece ended up as a pair of visualisations of London bus data. We took coordinates and timing information from TfL’s data feeds, cleaned it up, squished it all together and created some pretty videos.
We decided to use the Processing language for creating the visualisations. It’s a programming language designed for creating images and animations so it seemed like the right way to go. Having never done anything with it before I buried myself in a book for a few hours and got to grips with the basics.
While I was playing around trying to make 3D lines and animations the other techies on the team were attempting to get some data together. Here’s where we came unstuck a little. The information we’d started with wasn’t in the format we needed and was going to need some work to get it there. We tried hard, but we still hadn’t got the data in a form we wanted by the end of the weekend. Looking back I don’t know whether it was just the odd format of the data, or whether lack of sleep and mounting frustration combined to stop us thinking straight. The sheer amount of data didn’t help either, one of the data sets we’ve ended up playing with had over 120,000,000 data points just for a single 24 hour period.
As a result of our problems the visualisation we had by the end of the weekend wasn’t too impressive. However, we’ve carried on working on them since then and they’re starting to look pretty good.
Here’s my visualisation. It’s a full day of bus data - downloaded every minute from the TfL website, fed into MongoDB’s MapReduce and rendered as a video using a Processing script. Each white dot moving around is an individual bus doing its rounds, around 121,000 trips in total over 24 hours. It’s best viewed full screen in glorious HD.
What came next
One of the aspects of Sizzle 6 that, for me, has marked it out from other hack events is what’s happened afterwards.
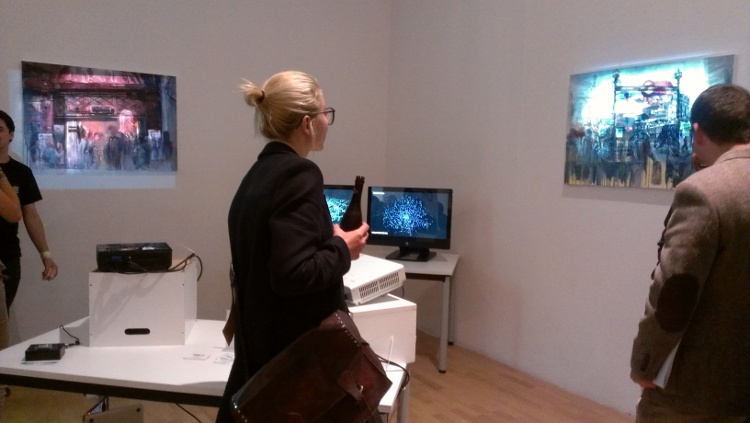
Presenting our projects at the end of the weekend was only the beginning. As well as running an impeccably organised hackathon, the 3 Beards had also organised an private exhibition at The Whitechapel Gallery with several hundred guests. This was a lot of fun. I really enjoyed hanging around our exhibit and chatting to people who looked interested. Sometimes I’d just step back and eavesdrop on people admiring what we’d done.
Over the course of the night there was a text message vote for people’s favourite project. Somehow we managed to win this, beating even the very excellent Real Weather project into second place.
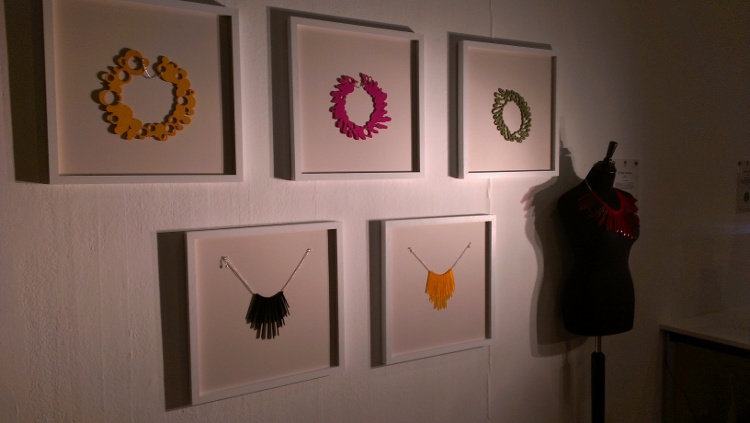
Many of the projects and collaborations will carry on into the future. Stef Lewandowski spent Sizzle 6 creating necklaces from Twitter data, including his wife’s stream of tweets. Since the weekend the Data Necklace project already has a Kickstarter-style website allowing you to order necklaces. It’s also been getting some press attention from the Wall Street Journal as well as some love from Bill Thompson, a technology writer for the BBC.
Project Gaia won’t stop here either. We’re meeting up soon to talk through what the next step is. The plan at the moment is to build up enough different pieces that we can put on our own exhibition in a few months time. I’m really excited to see where this might go, and where it might take us.
Update: Since I wrote this stories about Sizzle 6 have appeared in The Observer and on the BBC website.
